Abstract
Research Article
Statistical and equation model analysis on COVID-19
Bin Zhao* and Jinming Cao
Published: 03 July, 2020 | Volume 4 - Issue 1 | Pages: 005-012
Background: An infectious disease caused by a novel coronavirus called COVID-19 has raged across the world since December 2019. The novel coronavirus first appeared in Wuhan, China, and quickly spread to Asia and now many countries around the world are affected by the epidemic. The deaths of many patients, including medical staff, caused social panic, media attention, and high attention from governments and world organizations. Today, with the joint efforts of the government, the doctors and all walks of life, the epidemic in Hubei Province has been brought under control, preventing its spread from affecting the lives of the people. Because of its rapid spread and serious consequences, this sudden novel coronary pneumonia epidemic has become an important social hot spot event. Through the analysis of the novel coronary pneumonia epidemic situation, we can also have a better understanding of sudden infectious diseases in the future, so that we can take more effective response measures, establish a truly predictable and provide reliable and sufficient information for prevention and control model.
Methods: We establish different models according to the different developments of the epidemic situation, different time points, and different response measures taken by the government. To be specific, during the period of 2020.1.23-2020.2.7, the traditional SIR model is adopted; during the period of 2020.2.8-2020.3.30, according to the scientific research results, it was considered that the novel coronary pneumonia has a latent period, so in the later phase of epidemic development, the government has effectively isolated patients, thus we adopt the SEIQR model accordingly. During the period of 2020.3.31-2020.5.16, because more asymptomatic infected people were found, we use the SEIQLR model to fit. Finally, through a SEIR simulator, considering the susceptible number, the latent number, the infected number, the cured number, death number and other factors, we simulate the change of various numbers of people from the beginning to the next 180 days of novel coronary pneumonia.
Findings: The results based on the analysis of differential equations and kinetic models show that through the prediction of the model established in the first phase, the epidemic situation of novel coronary pneumonia in Hubei Province was controlled at the end of March, which is in line with the actual situation. The rest of Hubei province, except for Wuhan, lifted control of the departure channel from 0:00 am on March 25, and Wuhan was also unblocked on April 8. Through the establishment of the second-phase model, it is found that the epidemic situation will reach its peak in mid-February. For example, the quarantine admission of the hospital declined after mid-February, which is inseparable from the measures to build square cabin hospitals in early February so that more and more patients can be admitted. The model established in the third phase shows that the epidemic had been completely controlled by the end of May, which is also in line with the reality. Because in mid-May, the Wuhan government conducted a nucleic acid test on all the citizens to screen for asymptomatic infected persons to fundamentally control the spread of novel coronary pneumonia.
Interpretation: Hubei Province, as the center of the initial outbreak of novel coronary pneumonia, people were forced to be isolated at home during the Spring Festival, the most important Chinese holiday, and the whole society was in a state of suspension of work and study. The Chinese government had taken many measures in response to the epidemic, such as shutting down the city, vigorously building square cabin hospitals, and prohibiting people from gathering. At the beginning of May this year, the epidemic in Hubei Province was finally effectively controlled. For ordinary citizens, we should not cause unnecessary panic about the unknown novel coronavirus. Instead, we should fully understand and be familiar with this virus. In addition to the relevant medical knowledge, we should also understand the spread of infectious diseases through appropriate mathematical models. By mathematical models, we can understand the degree of harm of infectious diseases, when to control it, how to stop it, and use scientific views to reveal the original face of the novel coronavirus to the public without causing social panic.
Read Full Article HTML DOI: 10.29328/journal.abb.1001016 Cite this Article Read Full Article PDF
Keywords:
COVID-19; Pneumonia; Virus; Coronary; Differential equation; Infectious disease model
References
- Faraz AS, Quadeer Ahmed A, McKay Matthew R. Preliminary Identification of Potential Vaccine Targets for the COVID-19 Coronavirus (SARS-CoV-2) Based on SARS-CoV Immunological Studies. 2020; 12: 254. PubMed: https://www.ncbi.nlm.nih.gov/pmc/articles/PMC7150947/
- 2019 novel coronavirus.https://baike.baidu.com/item/2019E696B0E59E8BE586A0E78AB6E79785E6AF92/24267858?fr=aladdin (2020).
- Zhiqiang Q, Gang M, Xiaogang Z. Diagnosis and antiviral treatment of novel coronavirus pneumonia. Chinese J Clini New Medicine, 2020; 13: 429-435.
- Global outbreak of novel coronary pneumonia (COVID-19) briefing on 26 June. 2020. http://www.medsci.cn/article/show_article.do?id=1ecd19654400
- Outbreak of pneumonia with novel coronavirus infection in Hubei province, June 26. 2020. http://k.sina.com.cn/article_2607972104_9b727f0801900qi8n.html?from=local
- National Bureau of Statistics. 2020. http://www.stats.gov.cn/
- Ronggui L, Tao J. A study of technology diffusion models based on the SIR infectious disease model. J Manage Engineering. 2006: 37-40.
- Gui Z, Weide L, Lingfeng Z. Comparison of different control strategies based on the SIR infectious disease model. J North China University: Nature Science. 2011; 012: 265-269.
- Jianquan L, Feng W, Zhien M. A global analysis of a class of infectious disease models with quarantine. J Engine Mathemat. 2005; 022: 20-24.
- Shuangde Z, Hai H, Xihong Z. A class of models of infectious disease dynamics containing latency. J Mathema Med. 2002; 015: 385-386.
- Huilin C, Huiru D, Yinan Z, et al. SLICAR model of transmission considering both latency and onset of infection in cryptogenic populations. China Health Statistics. 2015; 032: 264-266.
- King A, Lonides EL,Pascual M. et al. Inapparent infections and cholera dynamics. Nature. 2008; 454: 877-880. PubMed: https://www.ncbi.nlm.nih.gov/pubmed/18704085
- Qiyuan K. Mathematical models. Higher Education Press, 2019.
- Frank R. Giordano, Mathematical modeling. Mechanical Industry Press. 2014
- Yong Y. Uniqueness of the overall existence of solutions to groups of equations of infectious disease dynamics. Annals of Mathematics: Chinese Edition. 1991; 86-98.
- An outbreak development simulation software based on the K-SEIRD mathematical model. 2020. http://www.trainingtech.cn/news/software_seir_simulator_show.html
- Wei P. Simulation modeling and MATLAB practical tutorial. Tsinghua University Press. 2019.
- Jianli Y, Juhua L, Shuigao J, et al. Mathematical modeling of infectious diseases and SARS prediction. Health Res. 2005; 034: 352-353.
- Research on Management Accounting Practice Diffusion Mechanism Based on Infectious Disease Model. 2020. http://xueshu.baidu.com/usercenter/paper/show?paperid=1p7b06u0tx330vx0pt4u0e8043639929&site=xueshu_se
- Zhao G, Zhong Y. Management accounting practice. Tsinghua University press. 2007; 10.
- Wang Z. Mathematical analysis on the Epidemic of Coronavirus Disease 2019. J Pharmacol Pharmaceut Pharmacovig. 2020; 4: 014.
- Yicang Z, Yun T. Mathematical models for SARS transmission prediction. J Engine Mathemat. 2003; 020: 53-62.
- Cruz-Rodriguez L, et al. How to Evaluate Viral Transmission in Enclosed Areas. J Bioscience Biomedical Enginee. 2020; 2: 1-8.
Figures:

Figure 1

Figure 2

Figure 3

Figure 4

Figure 5

Figure 6
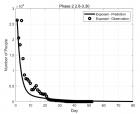
Figure 7
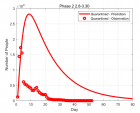
Figure 8
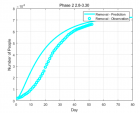
Figure 9

Figure 10

Figure 11

Figure 12

Figure 13
Similar Articles
-
Statistical and equation model analysis on COVID-19Bin Zhao*,Jinming Cao. Statistical and equation model analysis on COVID-19. . 2020 doi: 10.29328/journal.abb.1001016; 4: 005-012
-
Can the Wondfo® SARS-CoV-2 IgM/IgG antibodies be used as a rapid diagnostic test?Makson Gleydson Brito De Oliveira*,Lysandro Pinto Borges,Daniela Raguer Valadão de Souza,Kezia Alves Dos Santos,Luana Heimfarth. Can the Wondfo® SARS-CoV-2 IgM/IgG antibodies be used as a rapid diagnostic test?. . 2020 doi: 10.29328/journal.abb.1001017; 4: 013-017
-
Packaging challenge for COVID-19 drugAnupam Chand*. Packaging challenge for COVID-19 drug. . 2019 doi: 10.29328/journal.abb.1001019; 4: 028-036
-
Hypertension and sex related differences in mortality of COVID-19 infection: A systematic review and Meta-analysisProbir Kumar Ghosh*,Mohammad Manir Hossain Mollah,ABM Alauddin Chowdhury,Nazmul Alam,Golam Dostogir Harun. Hypertension and sex related differences in mortality of COVID-19 infection: A systematic review and Meta-analysis. . 2020 doi: 10.29328/journal.abb.1001020; 4: 037-043
-
Antimicrobial resistance of Klebsiella pneumoniae strains isolated from urine in hospital patients and outpatientsZeljko Cvetnić*,Maja Ostojic,Mahir Hubana,Marija Cvetnić,Miroslav Benić. Antimicrobial resistance of Klebsiella pneumoniae strains isolated from urine in hospital patients and outpatients. . 2021 doi: 10.29328/journal.abb.1001021; 5: 001-007
-
Sequence-independent single-primer-amplification (SISPA) as a screening technique for detecting unexpected RNA viral adventitious agents in cell culturesBehnam Alirezaie*,Davood Bahador,Ashraf Mohammadi,Abolhasan Foroughi. Sequence-independent single-primer-amplification (SISPA) as a screening technique for detecting unexpected RNA viral adventitious agents in cell cultures . . 2021 doi: 10.29328/journal.abb.1001022; 5: 008-012
-
OPEN and CLOSED state of SPIKE SARS-COV-2: relationship with some integrin binding. A biological molecular approach to better understand the coagulant effectLuisetto M*,Khaled Edbey,Mashori GR,Yesvi AR,Latyschev OY. OPEN and CLOSED state of SPIKE SARS-COV-2: relationship with some integrin binding. A biological molecular approach to better understand the coagulant effect . . 2021 doi: 10.29328/journal.abb.1001028; 5: 049-056
-
Diagnostic evaluation of nasopharyngeal swab and saliva kits against SARS-CoV-2: Adequate rapid screening is deemed necessary to overcome COVID-19 PandemicMuhammad Danish Yaqoob,Muhammad Abdul Ahad Khawaja,Qurat-ul-Ain Amjad,Atika Waseem,Kashmala Kanwal,Haleema Nadeem,Madiha Munir,Syeda Mushiat Zahra,Zahra Zahid Piracha,Umar Saeed*. Diagnostic evaluation of nasopharyngeal swab and saliva kits against SARS-CoV-2: Adequate rapid screening is deemed necessary to overcome COVID-19 Pandemic. . 2022 doi: 10.29328/journal.abb.1001032; 6: 010-013
-
Diagnostic evaluation of nasopharyngeal swab and saliva kits against SARS-CoV-2: Adequate rapid screening is deemed necessary to overcome COVID-19 PandemicMuhammad Danish Yaqoob. Diagnostic evaluation of nasopharyngeal swab and saliva kits against SARS-CoV-2: Adequate rapid screening is deemed necessary to overcome COVID-19 Pandemic. . -0001 doi: 10.29328/journal.abb.1001032; 6: 010-013
Recently Viewed
-
Sinonasal Myxoma Extending into the Orbit in a 4-Year Old: A Case PresentationJulian A Purrinos*, Ramzi Younis. Sinonasal Myxoma Extending into the Orbit in a 4-Year Old: A Case Presentation. Arch Case Rep. 2024: doi: 10.29328/journal.acr.1001099; 8: 075-077
-
Timing of cardiac surgery and other intervention among children with congenital heart disease: A review articleChinawa JM*,Adiele KD,Ujunwa FA,Onukwuli VO,Arodiwe I,Chinawa AT,Obidike EO,Chukwu BF. Timing of cardiac surgery and other intervention among children with congenital heart disease: A review article. J Cardiol Cardiovasc Med. 2019: doi: 10.29328/journal.jccm.1001047; 4: 094-099
-
Advancing Forensic Approaches to Human Trafficking: The Role of Dental IdentificationAiswarya GR*. Advancing Forensic Approaches to Human Trafficking: The Role of Dental Identification. J Forensic Sci Res. 2025: doi: 10.29328/journal.jfsr.1001076; 9: 025-028
-
Scientific Analysis of Eucharistic Miracles: Importance of a Standardization in EvaluationKelly Kearse*,Frank Ligaj. Scientific Analysis of Eucharistic Miracles: Importance of a Standardization in Evaluation. J Forensic Sci Res. 2024: doi: 10.29328/journal.jfsr.1001068; 8: 078-088
-
Toxicity and Phytochemical Analysis of Five Medicinal PlantsJohnson-Ajinwo Okiemute Rosa*, Nyodee, Dummene Godwin. Toxicity and Phytochemical Analysis of Five Medicinal Plants. Arch Pharm Pharma Sci. 2024: doi: 10.29328/journal.apps.1001054; 8: 029-040
Most Viewed
-
Evaluation of Biostimulants Based on Recovered Protein Hydrolysates from Animal By-products as Plant Growth EnhancersH Pérez-Aguilar*, M Lacruz-Asaro, F Arán-Ais. Evaluation of Biostimulants Based on Recovered Protein Hydrolysates from Animal By-products as Plant Growth Enhancers. J Plant Sci Phytopathol. 2023 doi: 10.29328/journal.jpsp.1001104; 7: 042-047
-
Sinonasal Myxoma Extending into the Orbit in a 4-Year Old: A Case PresentationJulian A Purrinos*, Ramzi Younis. Sinonasal Myxoma Extending into the Orbit in a 4-Year Old: A Case Presentation. Arch Case Rep. 2024 doi: 10.29328/journal.acr.1001099; 8: 075-077
-
Feasibility study of magnetic sensing for detecting single-neuron action potentialsDenis Tonini,Kai Wu,Renata Saha,Jian-Ping Wang*. Feasibility study of magnetic sensing for detecting single-neuron action potentials. Ann Biomed Sci Eng. 2022 doi: 10.29328/journal.abse.1001018; 6: 019-029
-
Pediatric Dysgerminoma: Unveiling a Rare Ovarian TumorFaten Limaiem*, Khalil Saffar, Ahmed Halouani. Pediatric Dysgerminoma: Unveiling a Rare Ovarian Tumor. Arch Case Rep. 2024 doi: 10.29328/journal.acr.1001087; 8: 010-013
-
Physical activity can change the physiological and psychological circumstances during COVID-19 pandemic: A narrative reviewKhashayar Maroufi*. Physical activity can change the physiological and psychological circumstances during COVID-19 pandemic: A narrative review. J Sports Med Ther. 2021 doi: 10.29328/journal.jsmt.1001051; 6: 001-007

HSPI: We're glad you're here. Please click "create a new Query" if you are a new visitor to our website and need further information from us.
If you are already a member of our network and need to keep track of any developments regarding a question you have already submitted, click "take me to my Query."


