Abstract
Review Article
Climate change - a review of the mass balance of biogenic and fossil carbon
Kirk T Cobb*
Published: 22 November, 2022 | Volume 6 - Issue 1 | Pages: 014-025
Trying to understand the causes of climate change can be confusing. On the one hand, methane (CH4) emissions from cattle, and methane emissions from food wastes in landfills, are said to contribute to greenhouse gases (GHGs) that drive climate change. People are working on feed additives for dairy cows to reduce their methane emissions. But, at the same time, cattle manure and food wastes can be fed into anaerobic digesters to convert these organic wastes to biogas; the resulting “renewable methane” or “renewable natural gas” (RNG), can be used in place of fossil natural gas and avoid extra GHG emissions and stop global warming. Can we have it both ways?
Burning gasoline in our cars and trucks generates carbon dioxide (CO2), which is said to contribute to climate change. But more than 8 billion people on planet Earth, breathe in oxygen and exhale carbon dioxide every minute of the day. And so do all the other animals who live on this planet, breathe in oxygen and exhale carbon dioxide. Is our breathing also contributing to climate change, just as the emissions from our automobile tailpipes?
It is time to step back from all the hype, evaluate the various sources of CO2 and CH4 being generated and review the “mass balance” of these gases in our atmosphere. Some of these are part of the natural biogenic carbon cycle and some are simply adding to the overall mass balance. What is driving climate change - excess GHGs from the biogenic carbon cycle, excess emissions from other sources, or both? Let’s take a fresh look at the available data.
(Of course, water vapor also plays a part in the climate change story, as a “positive feedback” effect. As non-condensable GHGs rise in concentration and slightly warm the planet, slightly warming oceans add a bit more water vapor to the story and push the warming up a bit more).
During the past few decades, a great deal of pertinent data has been carefully observed and recorded, by world-class scientists and engineers. This data is available in the public domain and is now easily available on the internet. These data sources come from reputable organizations, such as NASA (National Atmospheric and Space Administration), NOAA (National Oceanic and Atmospheric Administration), USGS (United States Geological Survey) and international organizations such as the “Global Carbon Project” and “Our-World-in-Data”.
How much of the growing concentration of CO2 (and CH4) in our atmosphere can be attributed to out-of-control emissions of biogenic carbon? How much of the CO2 rise can be attributed to fossil fuel emissions: 10%, 50%, 90%, or more?
The available data appear to show that the emissions from burning fossil fuels, more than account for all of the rise of carbon dioxide in our atmosphere during the past 60 years, or longer. In comparison, the biogenic carbon cycle data seem to be very consistent, year after year, decade after decade and have little or no impact on climate change. But, let’s have a closer look at the available data, and let the data speak for itself.
Read Full Article HTML DOI: 10.29328/journal.abb.1001033 Cite this Article Read Full Article PDF
Keywords:
Keeling Curve; Mass balance; Photosynthesis; Fossil carbon emissions; Biogenic carbon cycle
References
- Recent update of atmospheric composition from the NASA Earth Fact Sheet. https://nssdc.gsfc.nasa.gov/planetary/factsheet/earthfact.html
- Historical NASA CO2 https://data.giss.nasa.gov/modelforce/ghgases/Fig1A.ext.txt
- Reference to atmospheric pressure. aqua-calc.com/what-is/pressure/atmosphere
- Basic geometry of planet Earth. https://nssdc.gsfc.nasa.gov/planetary/factsheet/earthfact.html
- https://en.wikipedia.org/wiki/Atmosphere_of_Earth#:~:text=The%20atmosphere;
https://www.bing.com/search?q=mass+of+the+atmosphere+in+kg&form;
References for the mass of Earth’s atmosphere.https://www.britannica.com/story/how-much-does-earths-atmosphere-weigh
- Biography of Charles David Keeling. https://scrippsco2.ucsd.edu/history_legacy/charles_david_keeling_biographhtml
- Notes regarding Charles Keeling’s career.https://wiki.alquds.edu/?query=Keeling_Curve
- The Keeling Curve, published by the “NOAA Global Monitoring Laboratory” as of October 5, 2022 – note, this referenced website includes both the full Keeling Curve from 1958 to 2022, and the excerpt curve for 2018 through 2021, and a portion of 2022. https://www.esrl.noaa.gov/gmd/ccgg/trends/index.html
- Reference to the land masses of the Northern and Southern Hemispheres.worldatlas.com/articles/which-hemisphere-has-the-largest-area-covered-by-land.html
- Reference to the Keeling Curve biogenic carbon cycle as 6 PPMv for each annual season. https://wiki.alquds.edu/?query=Keeling_Curve:
- Reference to the Global Carbon Project website; note, the graph shown on page 9 was available from this website in 2017, but is no longer available; this graph in 2017 had been printed and scanned, but is no longer available in 2022. http://www.globalcarbonproject.org.
- Reference to the Global Carbon Project organization.https://en.wikipedia.org/wiki/Global_Carbon_Project
- Reference for “Our World in Data”. https://ourworldindata.org/co2-emissions
- Reference to volcanic CO2 emissions from the USGS. https://volcanoes.usgs.gov/vsc/file_mngr/file-154/Gerlach-2011-EOS_AGU.pdf
- Website for the UC-Davis regarding methane emissions from cattle. https://clear.ucdavis.edu/explainers/biogenic-carbon-cycle-and-cattle
- Methane, carbon dioxide, and the biogenic carbon cycle from UC-Davis.https://clear.ucdavis.edu/explainers/gwp-star-better-way-measuring-methane-and-how-it-impacts-global-temperatures
- US-EPA and the GWP – Global Warming Potential.https://www.epa.gov/ghgemissions/understanding-global-warming-potentials
- The US-EPA gets tough on methane leaks from the oil and gas sector.https://www.cnbc.com/2021/11/02/-biden-epa-gets-tough-on-methane-leaks-from-oil-and-gas-sector-.html
- Methane atmospheric concentrations from NOAA Mauna Loa Observatory from 1988 to 2021. https://en.wikipedia.org/wiki/Atmospheric_methane
- United Nations report – world must cut methane emissions.https://www.cnbc.com/2021/05/06/world-must-cut-methane-emissions-to-avoid-worst-of-climate-change-un-says.html
- NASA report on methane permafrost emissions.https://www.nasa.gov/feature/goddard/2018/unexpected-future-boost-of-methane-possible-from-arctic-permafrost
- World population.https://www.worldometers.info/world-population/world-population-by-year/
- Estimate of total annual photosynthetic CO2 from both the Northern and Southern Hemispheres. https://www.britannica.com/science/climate
Figures:
Figure 1
Figure 2
Figure 3
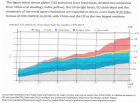
Figure 4
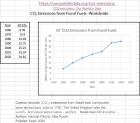
Figure 5
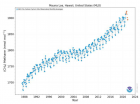
Figure 6
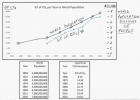
Figure 7

Figure 8

Figure 9

Figure 10

Figure 11
Figure 12

Figure 13

Figure 14
Figure 15
Similar Articles
-
Climate change - a review of the mass balance of biogenic and fossil carbonKirk T Cobb*. Climate change - a review of the mass balance of biogenic and fossil carbon. . 2022 doi: 10.29328/journal.abb.1001033; 6: 014-025
Recently Viewed
-
Prediction of neonatal and maternal index based on development and population indicators: a global ecological studySedigheh Abdollahpour,Hamid Heidarian Miri,Talat Khadivzadeh*. Prediction of neonatal and maternal index based on development and population indicators: a global ecological study. Clin J Obstet Gynecol. 2021: doi: 10.29328/journal.cjog.1001096; 4: 101-105
-
A Genetic study in assisted reproduction and the risk of congenital anomaliesKaparelioti Chrysoula,Koniari Eleni*,Efthymiou Vasiliki,Loutradis Dimitrios,Chrousos George,Fryssira Eleni. A Genetic study in assisted reproduction and the risk of congenital anomalies. Clin J Obstet Gynecol. 2021: doi: 10.29328/journal.cjog.1001095; 4: 096-100
-
Leiomyosarcoma in pregnancy: Incidental finding during routine caesarean sectionToon Wen Tang*,Phoon Wai Leng Jessie. Leiomyosarcoma in pregnancy: Incidental finding during routine caesarean section. Clin J Obstet Gynecol. 2021: doi: 10.29328/journal.cjog.1001094; 4: 092-095
-
Adult Neurogenesis: A Review of Current Perspectives and Implications for Neuroscience ResearchAlex, Gideon S*,Olanrewaju Oluwaseun Oke,Joy Wilberforce Ekokojde,Tolulope Judah Gbayisomore,Martina C. Anene-Ogbe,Farounbi Glory,Joshua Ayodele Yusuf. Adult Neurogenesis: A Review of Current Perspectives and Implications for Neuroscience Research. J Neurosci Neurol Disord. 2024: doi: 10.29328/journal.jnnd.1001102; 8: 106-114
-
Late discover of a traumatic cardiac injury: Case reportBenlafqih C,Bouhdadi H*,Bakkali A,Rhissassi J,Sayah R,Laaroussi M. Late discover of a traumatic cardiac injury: Case report. J Cardiol Cardiovasc Med. 2019: doi: 10.29328/journal.jccm.1001048; 4: 100-102
Most Viewed
-
Evaluation of Biostimulants Based on Recovered Protein Hydrolysates from Animal By-products as Plant Growth EnhancersH Pérez-Aguilar*, M Lacruz-Asaro, F Arán-Ais. Evaluation of Biostimulants Based on Recovered Protein Hydrolysates from Animal By-products as Plant Growth Enhancers. J Plant Sci Phytopathol. 2023 doi: 10.29328/journal.jpsp.1001104; 7: 042-047
-
Sinonasal Myxoma Extending into the Orbit in a 4-Year Old: A Case PresentationJulian A Purrinos*, Ramzi Younis. Sinonasal Myxoma Extending into the Orbit in a 4-Year Old: A Case Presentation. Arch Case Rep. 2024 doi: 10.29328/journal.acr.1001099; 8: 075-077
-
Feasibility study of magnetic sensing for detecting single-neuron action potentialsDenis Tonini,Kai Wu,Renata Saha,Jian-Ping Wang*. Feasibility study of magnetic sensing for detecting single-neuron action potentials. Ann Biomed Sci Eng. 2022 doi: 10.29328/journal.abse.1001018; 6: 019-029
-
Pediatric Dysgerminoma: Unveiling a Rare Ovarian TumorFaten Limaiem*, Khalil Saffar, Ahmed Halouani. Pediatric Dysgerminoma: Unveiling a Rare Ovarian Tumor. Arch Case Rep. 2024 doi: 10.29328/journal.acr.1001087; 8: 010-013
-
Physical activity can change the physiological and psychological circumstances during COVID-19 pandemic: A narrative reviewKhashayar Maroufi*. Physical activity can change the physiological and psychological circumstances during COVID-19 pandemic: A narrative review. J Sports Med Ther. 2021 doi: 10.29328/journal.jsmt.1001051; 6: 001-007

HSPI: We're glad you're here. Please click "create a new Query" if you are a new visitor to our website and need further information from us.
If you are already a member of our network and need to keep track of any developments regarding a question you have already submitted, click "take me to my Query."


