Figure 3
Integration of GC-MS in identification of possible final metabolites from phytase production in Pichia Pastoris based on sorbitol induction optimization
Ndayambaje Jean Bernard*, Habarurema Gratien, Habinshuti Janvier, Ingabire Angelique, Ingabire Ange Sabine, Martin Patrick Ongol and S Meenakshisundaram
Published: 12 April, 2021 | Volume 5 - Issue 1 | Pages: 020-025

Figure 3:
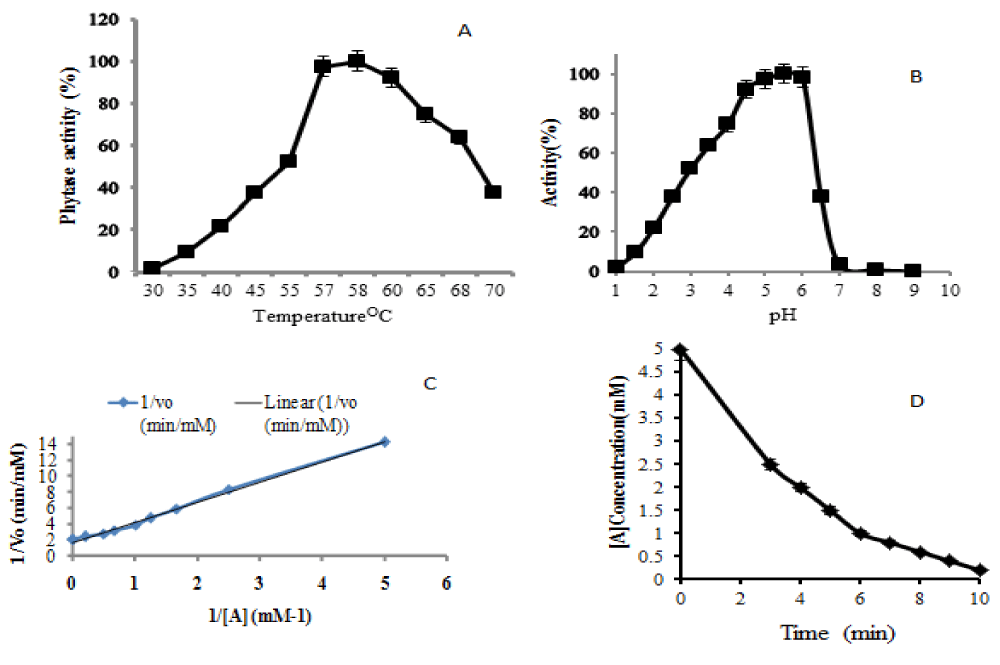
Evaluation of optimum temperature for recombinant Pichia Pastoris expressed phytase (A), Evaluation of optimum pH for recombinant Pichia Pastoris expressed phytase (B), Lineweaver Burke plot of recombinant Pichia Pastoris expressed phytase (C) and the measurement of half time required for substrate consumption (D).
Read Full Article HTML DOI: 10.29328/journal.abb.1001024 Cite this Article Read Full Article PDF
More Images
Similar Articles
-
Integration of GC-MS in identification of possible final metabolites from phytase production in Pichia Pastoris based on sorbitol induction optimizationNdayambaje Jean Bernard*,Habarurema Gratien,Habinshuti Janvier,Ingabire Angelique,Ingabire Ange Sabine,Martin Patrick Ongol,S Meenakshisundaram. Integration of GC-MS in identification of possible final metabolites from phytase production in Pichia Pastoris based on sorbitol induction optimization. . 2021 doi: 10.29328/journal.abb.1001024; 5: 020-025
-
Microalgal Derivatives as Potential Nutraceutical and Pharmaceutical: Boon to Human BeingsNamrata Dash, Amit Kumar Bajhaiya, Chandrashaker B, Poornachandar Gugulothu*. Microalgal Derivatives as Potential Nutraceutical and Pharmaceutical: Boon to Human Beings. . 2024 doi: 10.29328/journal.abb.1001040; 8: 0170-026
Recently Viewed
-
Assessment of knowledge on breast self-examination among female adolescent: a cross-sectional studyPooja Prakash,Shanti Khadka,Muna Silwal,Ayush Chandra*. Assessment of knowledge on breast self-examination among female adolescent: a cross-sectional study. Clin J Obstet Gynecol. 2022: doi: 10.29328/journal.cjog.1001104; 5: 036-041
-
Addition of dydrogesterone to vaginal progesterone and transfer postponement improve outcomes in patients with low progesterone levels in hormonally substituted cycles for frozen-thawed embryo transferAnne Lecourt,Julie Labrosse,Maeliss Peigné,Claire Vinolas,Laetitia Laup,Christophe Sifer,Michael Grynberg,Isabelle Cedrin-Durnerin*. Addition of dydrogesterone to vaginal progesterone and transfer postponement improve outcomes in patients with low progesterone levels in hormonally substituted cycles for frozen-thawed embryo transfer. Clin J Obstet Gynecol. 2022: doi: 10.29328/journal.cjog.1001103; 5: 027-035
-
Research of Potential Production 94mTc in Medical CyclotronGerman KE*, Rumyantsev AS, Manukova VA. Research of Potential Production 94mTc in Medical Cyclotron. J Clin Intensive Care Med. 2024: doi: 10.29328/journal.jcicm.1001050; 9: 027-030
-
Cessation of Menstruation during Pregnancy: OverviewValery Rapovets*. Cessation of Menstruation during Pregnancy: Overview. Clin J Obstet Gynecol. 2024: doi: 10.29328/journal.cjog.1001172; 7: 100-102
-
An Appraisal of Recurrent Miscarriage in Sub-Saharan Africa: Occurrence and Possible SolutionSanmi Emiade*, Bolanle OP Musa, Adekunle O Oguntayo, Abduazeez Hassan, Yemi Balogun. An Appraisal of Recurrent Miscarriage in Sub-Saharan Africa: Occurrence and Possible Solution. Clin J Obstet Gynecol. 2024: doi: 10.29328/journal.cjog.1001173; 7: 103-106
Most Viewed
-
Evaluation of Biostimulants Based on Recovered Protein Hydrolysates from Animal By-products as Plant Growth EnhancersH Pérez-Aguilar*, M Lacruz-Asaro, F Arán-Ais. Evaluation of Biostimulants Based on Recovered Protein Hydrolysates from Animal By-products as Plant Growth Enhancers. J Plant Sci Phytopathol. 2023 doi: 10.29328/journal.jpsp.1001104; 7: 042-047
-
Sinonasal Myxoma Extending into the Orbit in a 4-Year Old: A Case PresentationJulian A Purrinos*, Ramzi Younis. Sinonasal Myxoma Extending into the Orbit in a 4-Year Old: A Case Presentation. Arch Case Rep. 2024 doi: 10.29328/journal.acr.1001099; 8: 075-077
-
Feasibility study of magnetic sensing for detecting single-neuron action potentialsDenis Tonini,Kai Wu,Renata Saha,Jian-Ping Wang*. Feasibility study of magnetic sensing for detecting single-neuron action potentials. Ann Biomed Sci Eng. 2022 doi: 10.29328/journal.abse.1001018; 6: 019-029
-
Pediatric Dysgerminoma: Unveiling a Rare Ovarian TumorFaten Limaiem*, Khalil Saffar, Ahmed Halouani. Pediatric Dysgerminoma: Unveiling a Rare Ovarian Tumor. Arch Case Rep. 2024 doi: 10.29328/journal.acr.1001087; 8: 010-013
-
Physical activity can change the physiological and psychological circumstances during COVID-19 pandemic: A narrative reviewKhashayar Maroufi*. Physical activity can change the physiological and psychological circumstances during COVID-19 pandemic: A narrative review. J Sports Med Ther. 2021 doi: 10.29328/journal.jsmt.1001051; 6: 001-007

HSPI: We're glad you're here. Please click "create a new Query" if you are a new visitor to our website and need further information from us.
If you are already a member of our network and need to keep track of any developments regarding a question you have already submitted, click "take me to my Query."


